Results
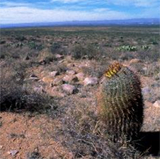
Result 1: Remote Sensing Rio Bravo
MODIS images have been used for the generation of the land use map. The same images are used as input into the SEBAL energy balance model to compute evapotranspiration (actual, potential, reference), biomass production and soil moisture. SEBAL is propriety software of WaterWatch. The rainfall map is derived from the TRMM passive microwave satellite
Click link below
Result 2: SWAT results Rio Bravo
Click on the map to activate one of the 23 sub-basins and view the water balance. The water balance describes the water flows in the unsaturated zone computed with the SWAT model. The term 'revap' expresses inflow due to capillary rise and seepage water received from neighboring sub-basins; Etact is actual evapotranspiration. SWAT is developed jointly by Texas A&M University and ARS-USDA (Texas)
Click link below
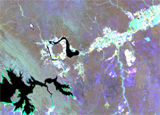
Results 3: Delicias Landsat
Detailed ET and related parameters have been derived from SEBAL in conjunction with Landsat imagery. This allows to evaluate crop water demand, crop water use and crop production on a crop-to-crop basis. An unsupervised crop classification map has been made for the sake of demonstrating the additional opporutinities of high resolution satellite images. The results exhibit fields that are extra-ordinary wet and could thus be asked to conserve precious irrigation water from the Rio Conchos. The Landsat data is also suitable to compare with traditional field scale water balance and lysimeter studies.
Click link belowResults 4: Delicias MODIS
Monthly products have been created to show the impact of the seasons on the land and water resources. The impact of irrigation on the annual production and consumption cycle is clearly visible.
Click link below
Results 5: Remote Sensing Aguascalientes and northern aquifers
To demonstrate the power of MODIS remote sensing data to monitor all irrigated areas - and their underlying aquifers - in Central and Northern Mexico, the same SEBAL analysis has also been repeated for Aguascalientes and the Northern Central Valleys. The vast irrigated areas in the Lerma-Chapala Basin (e.g. Guanajuato) are included. Comision Nacional del Agua has now a tool that shows them (i) groundwater abstraction, (ii) irrigation performance and (iii) water productivity.
Click link below
|
|
|
||||||||
|
|
 |
|
|
||||||
|
|
|
|
|
||||||
|
|
|
|
|
|
|
|
|||
|
|
|
|
|||||||
|
|
|
||||||||
|
|
|
||||||||