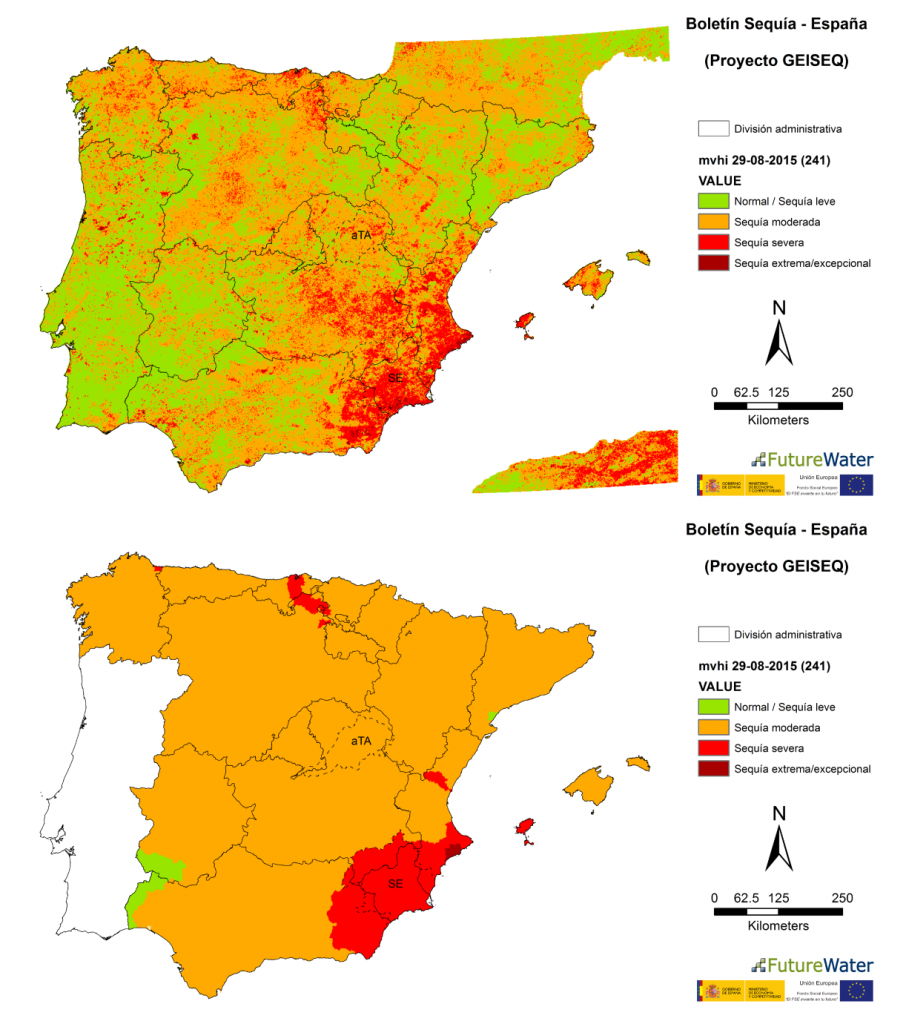
FutureWater launches InfoSequia, a website with data updates on the drought status of the Iberian Peninsula. InfoSequía provides weekly drought bulletins with maps of satellite-based drought indices that complement hydrological drought indices used by Spanish Water Basin Authorities.
In Spain drought management is regulated by Law 10/2001 of the National Hydrological Plan which requires: 1) to implement a National Drought Monitoring System (DMS) based on hydrological indicators for declaring drought periods, and 2 ) to develop Basin Drought Management Plans (PES) at the basin scale.
The current National DMS which supports the Basin Drought Management Plan is based on a hydrological drought indicator, the “Hydrological Drought State Index” (IEH), which is computed at the basin / sub-basin level using data on the total water which is stored in reservoirs or is flowing along rivers, and the quantitative status of aquifers. The IEH value ranges between 0 (representing the worst historical situation in terms of water scarcity) and 1 (wettest situation). From the values of the IEH and well-adopted thresholds, four classes or levels of drought status (Normal/Pre-alert/Alert/Emergency) are set up. Depending on the drought level reported , Water Basin Authorities define different management objectives and adopt strategic, tactical or emergency measures to reduce the negative impacts of water scarcity (Figure 1).

By its nature, the IEH allows the detection and monitoring of hydrological droughts, and anticipates on risks of suffering a socioeconomic drought with restrictions of water for irrigation, industry activities or household consumption. However, hydrological droughts usually occur after a more or less prolonged period of lack of rainfall (meteorological drought) and water shortage in the soil (soil / agronomic drought). Because of this, the adoption of an isolated hydrological drought indicator, as is being used currently, may question its usefulness to generate early warnings (Figure 2).

Since late 2013, FutureWater is actively working on the design of an operational toolbox called GEISEQ (Gestión Integral de Sequías) which includes a specific module for the detection and monitoring of droughts in “near-real” time. Following the latest recommendations provided by the scientific community which advise on the complementary use of different indicators, GEISEQ includes information from different satellite drought indices to characterize the impact of low rainfall inputs on soil moisture and productivity vegetation (Figure 2).
InfoSequía is a web portal that provides weekly drought bulletins with relevant satellite-based drought indices of the Iberian Peninsula. These indices, which are computed using satellite data provided by MODIS sensors of the North American Space Agency (NASA), report the observed anomalies of a variable (a vegetation greenness index or the land surface temperature) regarding the averaged value measured over a reference period. Similarly to the Spanish Drought Monitoring System, the anomalies are codified into four warning levels. In GEISEQ, anomalies can be refereed to specific dates (Singular Index) or to longer periods (1 year) in order to capture the cumulative effects of droughts on the state variables (Multitemporal Index). Finally, results are shown through spatially-distributed layers or aggregated according to areas of special interest (administrative boundaries, protected natural areas, agriculture demand units, water resource systems, etc.) (Figure 3).

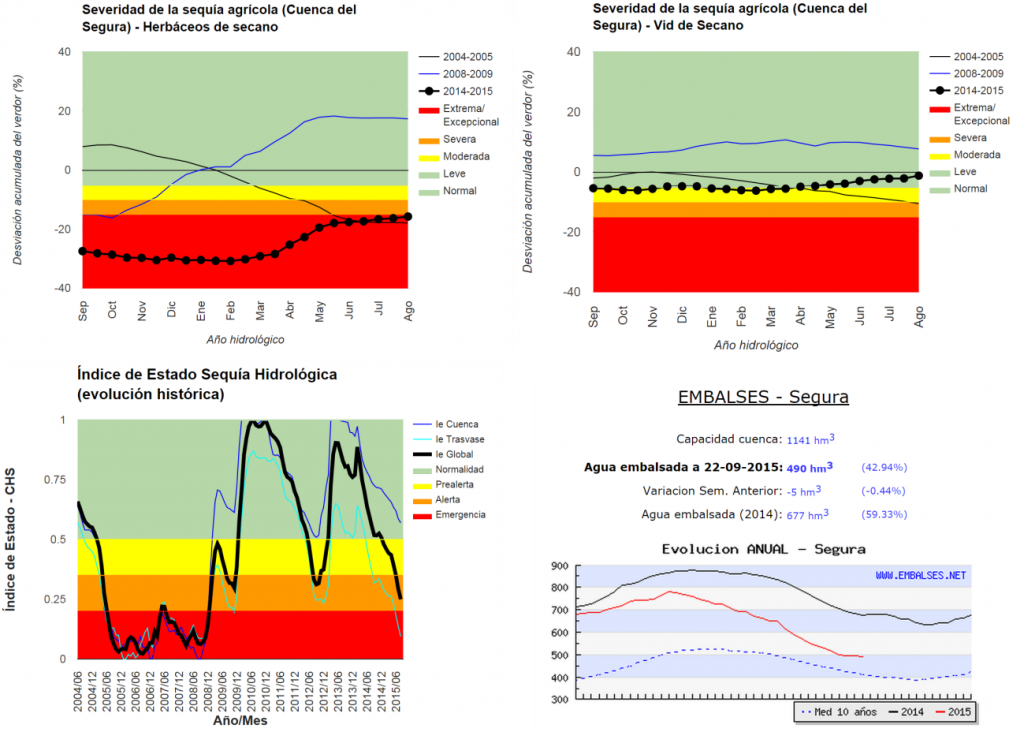
At present, drought bulletins provided by InfoSequía cover the entire Iberian Peninsula. In addition, for the Segura River Basin, considered a pilot basin for the purposes of GEISEQ basin, map resources are complemented with interactive graphs and figures which show: a) the impacts of droughts on the productivity of rainfed agriculture (e.g. herbaceous crops and vineyards), b) the IEH index updated every month by the Segura River Basin Authority, and c) the total surface water stored in reservoirs located in the Segura basin or those located in the head of the Tajo basin which supply resources to the Tajo-Segura aqueduct (Figure 4).

GEISEQ is a Spanish project co-funded by the European Social Fund through the Torres Quevedo Programme of the General Directorate of Scientific and Technical Research (Spanish Ministry of Economy and Competitiveness). For more information, please contact the project leader Sergio Contreras.
![]()
